
Բլեքջեքի հիմնական ռազմավարություն. որոշումների աղյուսակ առանց մոգության

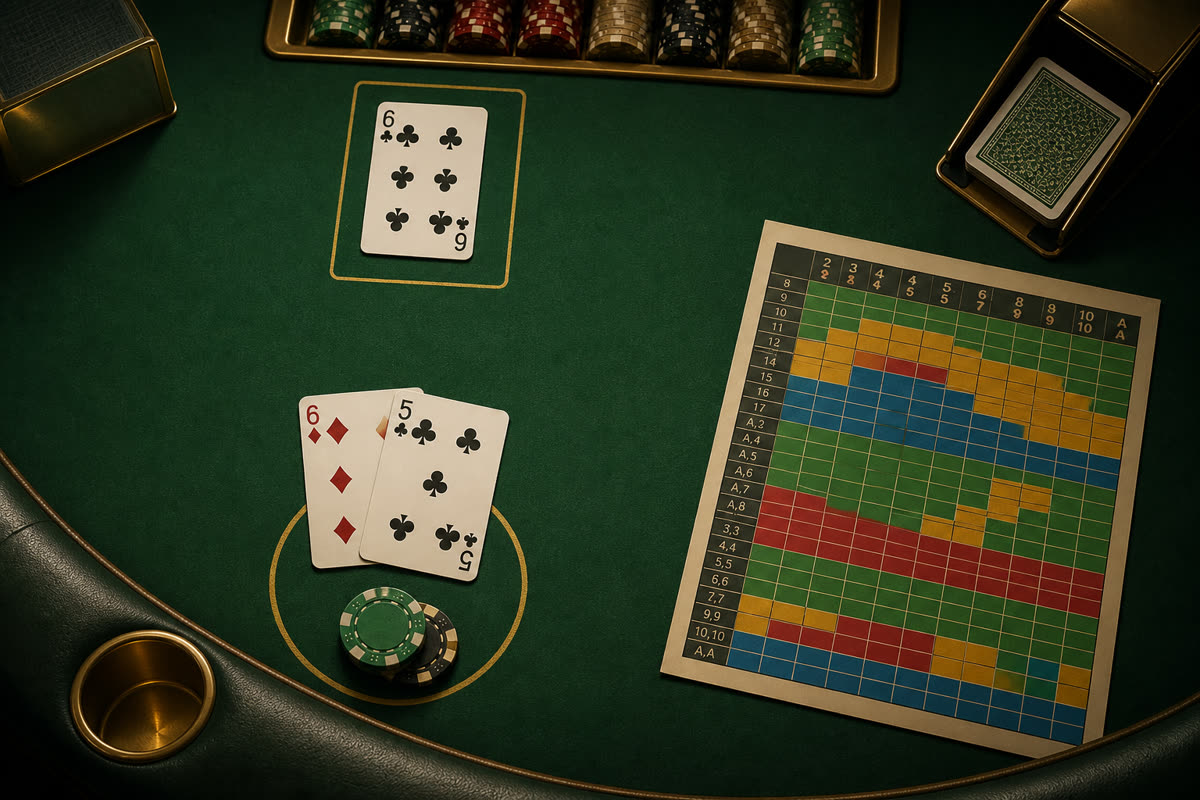
Հիմնական ռազմավարությունը ինտուիցիան չէ: Սա որոշված քարտ է. յուրաքանչյուր խաղացողի ընդհանուր գումարի դիմաց յուրաքանչյուր դիլերի բաց քարտի դիմաց մեկ գործողություն առավելագույնի է հասցնում ակնկալիքը: Եթե հետևեք դրան, դուք չեք հաղթում խաղատանը, այլ հրաժարվում եք լրացուցիչ առավելություն տալ խաղի ներկառուցված «ռեյկի» վերևում:
Սեղանի գոտիները մի հայացքով
Ինչ է իրականում օպտիմալացնում աղյուսակը
Blackjack-ն ավարտված է: Հաշվի առնելով տախտակամածի հայտնի կազմը, յուրաքանչյուր զույգ (ձեր ընդհանուր թիվը, դիլերի քարտը) մաթեմատիկորեն ավելի լավ գործողություն ունի: Հիմնական ռազմավարությունը պատասխանների աղյուսակն է՝ միջինացված միլիոնավոր սիմուլյացիաների վրա: Դուք չեք գուշակում հաջորդ խաղաքարտը. դուք ընտրում եք այն գիծը, որն ամենաքիչն է կորցնում երկար ժամանակ:
Կոշտ գումարներ. որտեղ փողը հոսում է
Ցավոտ գոտին կոշտ է 12–16 դիլերի ուժեղ քարտի նկատմամբ: 16 vs 10 կանգնելը կարծես կապիտուլյացիա լինի. հարված - ինքնասպանություն. Աղյուսակում գրված է հարված - քանի որ կանգառը կորցնում է նման ձեռքերի ~74%, հարվածել - ~62%: 12 տոկոսային միավոր տարբերությունն այն է, թե ինչու կարգապահությունը հաղթում է քաջությանը:
- Երբեք մի կանգնեք կոշտ 16 vs 7–A - միշտ հարվածեք:
- Կանգնեք կոշտ 12–16 միայն այն դեպքում, երբ դիլերն ունի 2–6 (թույլ քարտեր):
- Կրկնապատկել կոշտ 11 ընդդեմ 2–10; կոշտ 10 ընդդեմ 2–9-ի վրա:
- Մի վերցրեք ապահովագրություն. դա ~7% առավելություն ունեցող կողմ է, ոչ թե պաշտպանություն:
Փափուկ ձեռքեր և զույգեր՝ անվճար կապիտալ
11 նման էյսը փոխում է ամեն ինչ: Փափուկ 18 (A-7) ուժեղ տեսք ունի, քանի դեռ դիլերը չունի 9, 10 կամ ace - հետո հարվածել, կանգնել դանդաղ արյունահոսում է: Զույգեր - բաժանման մեքենա՝ 8,8 միշտ (երկու ութը կորցնում են, երկու հնարավորություն 18 - ոչ), A, A միշտ, 10,10 երբեք: 9,9 բաժանել ընդդեմ 2–6 և 8,9, կանգնել ընդդեմ 7, 10, A:
Ես հիշում եմ, թե ինչպես էի «կարդում» դիլերին սեղանի փոխարեն
Հիշում եմ մի խաղ, որտեղ երեք անգամ անընդմեջ կանգնեցի 16-ը ընդդեմ 10-ի, դիլերը թվաց «սառը»: Ես դրեցի 20, 19, 20: Մինուս $120 տասներկու րոպեի ընթացքում $20 սեղանի վրա - ոչ այն պատճառով, որ ես բլեքջեք եմ նետել, այլ այն պատճառով, որ վճարել եմ ~12% հարկ սովորական առավելությունից վեր՝ քաշելով պոկերի «ընթերցվողները» սեղանի վրա: Դրանից հետո ես սեղանը երկու շաբաթ պահեցի մոնիտորի վրա։ Ձանձրալի. Գումարած.
Bankroll. Համապատասխանություն աղյուսակին որպես մետրիկ
Հաշվեք շեղումները, ոչ միայն հաղթանակները/պարտությունները: 200 ձեռք, 10 շեղումներ - ավելացվել է ~1–3% արդյունավետ առավելություն այս կետերում: Դադարեցրեք կորուստը միավորներով, ոչ թե դոլարով. 50–100× նվազագույն խաղադրույք հանգստի համար, 200× եթե կրկնապատկվեք կորուստներից հետո (աղյուսակը խորհուրդ չի տալիս, մարդիկ դա անում են ամեն դեպքում):
Տպեք սեղանը, մեկ շաբաթ խաղացեք NUTS POKER բլեքջեք սեղանների վրա, այնուհետև մտապահեք վերը նշված հինգ գոտիները: Եթե դեռ կռահում եք դժվար 16-ը ընդդեմ 10-ի, դա ոչ թե խաղի, այլ պոկերի բնազդների մասին է մաթեմատիկական սեղանի շուրջ:


